Trading Guide: Understanding Bot Profit Metrics
Before choosing an AI trading bot, traders should understand the numbers behind the performance. Learn how to read ROI, daily percentage, total percentage, risk level, drawdown, and other key bot metrics on Panometrix Capital.
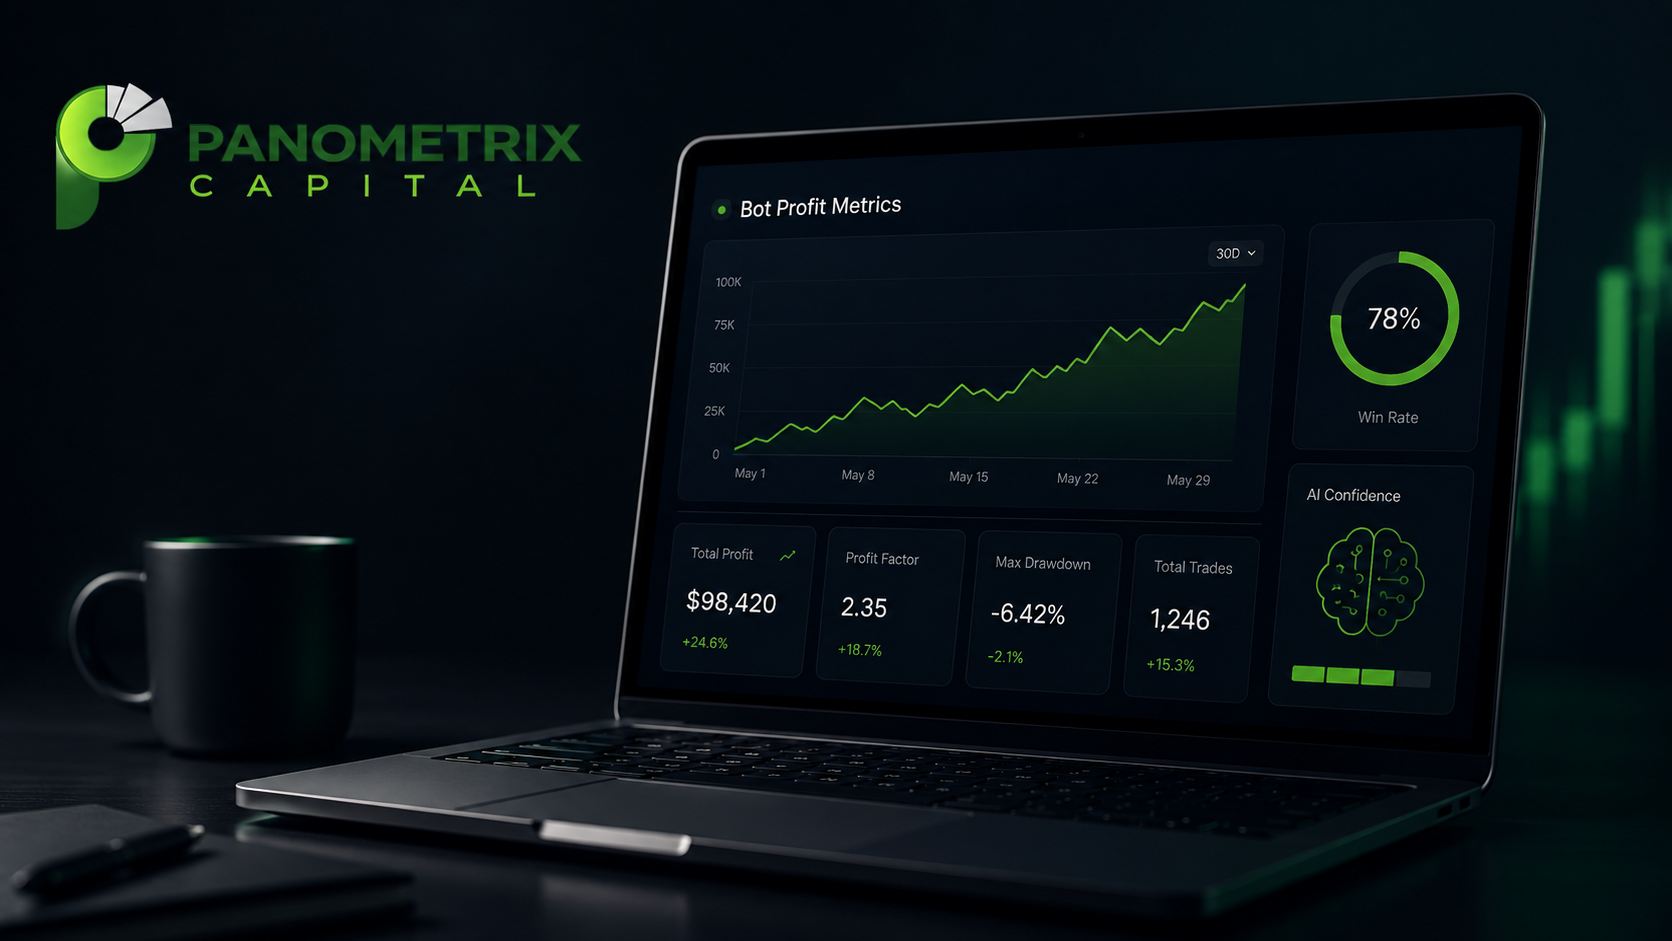
AI-powered trading bots can make trading look simple, but smart traders know one thing: the numbers matter.
Before choosing any bot, it is important to understand the profit metrics behind it. A bot may show high returns, strong activity, or an attractive risk profile, but each metric tells a different part of the story.
At Panometrix Capital, traders can explore AI-powered bots across different risk profiles, including low-risk, medium-risk, and high-risk strategies. Understanding the key metrics helps users choose bots that better match their trading goals, risk tolerance, and market expectations.
1. Running Percentage
The running percentage usually represents the daily or recurring profit range while the bot is active.
For example, if a bot shows:
Running Percentage: 0.60%
End Percentage: 0.90%
This means the bot may be positioned within a daily performance range between 0.60% and 0.90%, depending on the strategy structure and market conditions.
This metric helps traders understand the bot’s expected activity level. Lower-risk bots usually have lower daily percentages, while high-risk bots may show higher daily ranges.
2. End Percentage
The end percentage usually represents the upper end of the bot’s expected recurring return range.
It should be viewed together with the running percentage.
A wide gap between running percentage and end percentage may suggest a more aggressive or variable strategy. A smaller range may suggest a more stable or conservative approach.
For example:
A low-risk bot may show:
0.60% – 0.90%
A high-risk bot may show:
5.80% – 7.50%
The higher range may look more attractive, but it usually also means higher risk exposure.
3. Total Percentage
The total percentage is one of the most important figures because it shows the projected or displayed total return over the bot’s full cycle.
For example:
Total Percentage: 94%
Repeat Time: 90 Days
This means the bot is showing a 94% total return over a 90-day cycle.
If another bot shows:
Total Percentage: 586.4%
Repeat Time: 30 Days
That is a much more aggressive profile and should be treated as high risk.
The key lesson is simple:
Do not look at total percentage alone. Always compare it with the repeat time, risk profile, strategy type, and market exposure.
4. Repeat Time
Repeat time shows the length of the bot cycle.
For example:
Repeat Time: 30 Days
means the bot runs on a 30-day cycle.
Repeat Time: 90 Days
means the bot runs on a 90-day cycle.
This matters because a 100% return over 90 days is very different from a 100% return over 30 days. Shorter timelines with very high returns usually suggest more aggressive strategies.
5. Repeat Compound
Repeat compound shows how often the bot’s activity is calculated or compounded.
If the setting says:
Repeat Compound: Daily
it means the bot’s performance cycle is structured on a daily basis.
Daily compounding can be powerful, but traders should understand that compounding also depends on market performance, strategy execution, and risk conditions.
6. Risk Profile
Risk profile is one of the most important indicators on any trading bot.
At Panometrix Capital, bot strategies can be grouped into simple categories:
Low Risk
Designed for traders who prefer capital preservation, reduced volatility, and more stable performance.
Medium Risk
Designed for traders seeking a balance between growth potential and controlled exposure.
High Risk
Designed for experienced traders comfortable with stronger volatility, faster movement, and higher potential returns.
A high return does not automatically mean a better bot. The best bot is the one that fits the trader’s own risk tolerance.
7. Active Traders
Active traders shows how many users are currently using or subscribed to a bot.
A higher number of active traders can suggest popularity and user interest, but it should not be the only reason to choose a bot.
Smart traders still review:
Risk level
Total percentage
Strategy type
Market focus
Repeat time
Performance consistency
Popularity can create confidence, but risk management should still come first.
8. Assets Managed
Assets managed shows the total amount of funds allocated to that bot or strategy.
For example:
Assets Managed: 5.8M USDT
This can help users understand the scale of participation in a bot. A bot with higher assets managed may appear more established, but traders should still evaluate the strategy carefully.
Large assets managed does not remove market risk.
9. Strategy Type
Different bots use different strategy models.
Examples include:
Conservative AI Swing
AI Grid Trading
Smart Hedging AI
Neural Forecast Trading
AI Momentum Scalping
Each strategy behaves differently.
A conservative swing bot may focus on slower, more stable movement.
A grid bot may perform better in ranging markets.
A momentum scalping bot may be more aggressive and active.
A hedging bot may focus more on protecting capital during volatility.
Understanding the strategy helps traders avoid choosing a bot based only on profit percentage.
10. Markets Traded
The markets a bot trades also matter.
Some bots may focus on:
BTC
ETH
Gold
EUR/USD
Crypto futures
Forex and indices
Each market has a different risk pattern. Crypto futures can move quickly and may carry higher risk. Gold and forex may behave differently depending on global market conditions. A trader should always understand what market the bot is exposed to before subscribing.
How Panometrix Capital Helps Traders Choose Smarter
Panometrix Capital gives traders access to AI-powered trading bots designed around different market styles and risk profiles.
Instead of forcing every trader into one strategy, Panometrix allows users to explore bots based on their preferred level of exposure. A conservative trader may prefer a low-risk capital preservation bot. A growth-focused trader may choose a medium-risk AI strategy. A more experienced trader may explore high-risk momentum bots.
This structure helps users make more informed decisions.
Panometrix Capital is also built around speed and automation. In fast-moving markets, execution speed matters. AI-powered bots can help monitor opportunities, respond to market conditions, and execute strategies without relying entirely on manual reaction time.
The goal is not just to trade more.
The goal is to trade with better structure, faster execution, and clearer risk awareness.
Final Thought
Bot profit metrics can be attractive, but they must be understood properly.
A smart trader does not only ask:
“How much can this bot make?”
A smart trader also asks:
What is the risk level?
How long is the cycle?
What market does it trade?
What is the strategy?
How aggressive is the daily percentage?
Does this match my risk tolerance?
AI-powered bots can be valuable tools, but responsible trading still requires education, discipline, and risk awareness.
At Panometrix Capital, traders can learn first, compare strategies, choose their risk profile, and use automation more intelligently.
Trade smarter. Understand the numbers. Let automation work with strategy.
Related Articles

P2P Trading Explained: Flexible Access for Modern Traders
P2P trading gives users a flexible way to buy and sell digital assets directly with other users. Learn why it matters and how Panometrix Capital brings P2P into a broader modern trading ecosystem.

Copy Trading Explained: How Beginners Can Follow Experienced Traders
Copy trading allows users to follow experienced traders and automatically mirror their trades. Learn how it works, its advantages, risks, and how Panometrix Capital helps traders participate with more structure and confidence.